Is Trevor Story the most improved player from last season? Well lucky for us, we have the power of data to answer that question without speculation.
2017 was less than stellar for the Rockies shortstop. He hit .239 / .308 / .457. Nothing to write home about, even with the slightly above average slugging percentage. To someone just watching his games, and not looking at any data, it seemed like all of his plate appearances resulted in a home run or a strikeout. He was the demonstrative player of the “home run spike” hitting attitude: hit a bomb or strikeout trying.
The most indicative statistic of Story’s struggles was his K%. He struck out in more than a third of his at bats, resulting in a K% of 34.4%. Yikes.
I’ll be the first to admit, I carried these notions into 2018 without giving him much of a chance. Watching him play, it seemed like it was the same old story (pun intended and I’m not even sorry). It felt like he was striking out too much, but also hitting home runs. I was using my gut. Turns out that’s not the best idea. Let’s see what the data tells us:
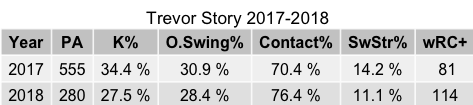
First and foremost, we can see his strikeout percentage has dropped significantly. A 6.9 point drop in fact! That’s a notable improvement already. There are a few other interesting metrics to look at in the chart too. O.Swing%, or outside-zone swing percentage, is the percentage of pitches outside the zone that Story swung at. It makes sense that a modest 2.5% drop in that category would be a sign of improved plate discipline. However, not all swings outside the zone are created equal, as demonstrated below:

But in general, not swinging at pitches outside the zone will give the hitter a higher chance of getting a hit. And this is confirmed by the fact that Story’s Contact% (number of pitches he made contact with divided by the total number of swings) increased by 6%. Swinging at fewer bad pitches equals more contact. Makes sense. Even Story’s overall swinging strike percentage has decreased 3.1%. Essentially, all of these numbers confirm that Story seems to be more patient and is making more contact than in 2017.
So What?
So far, it seems like Story’s “most-improved” bid is looking pretty good. After all, his wRC+ has increased 33 points to a respectable 114. But how do we measure improvement anyway? Which metric do we choose to look at? There’s no right answer to these questions, and there probably never will be. But I do have one possible way to measure a hitter’s performance from year to year…
So Story is making more contact. Great. But is he making good contact? Is he really “barreling up the ball” as they say? If only there was a metric that could tell us that. If only we could just count how many times Trevor Story has made “solid” contact.
Well it turns out, we can, and we do, thanks to StatCast. The statistic is appropriately called a “Barrel” and was created by the Sabermetric King himself, Tom Tango. Basically, if a ball is hit hard (with an exit velocity at or above 98 mph) and in the right direction (with a launch angle between 26 – 30 degrees) then it’s considered a barrel. However, if the ball is hit even harder, then the acceptable range of launch angles expands. With an exit velocity of 99 mph, the ball needs a launch angle between 25 – 31 degrees. An exit velocity of 100 mph requires a launch angle of 24 – 33 degrees. This pattern continues until the ball reaches an exit velocity of 116 mph or more (i.e. a rocket). At that point, any ball hit between 8 and 50 degrees is a barrel.
If a player is making good contact, we can expect that he would have a high number of barrels per plate appearance (Brls / PA). Story has a Brls / PA of about 8.0% so far this season. That puts him in 41st place amongst hitters with at least 110 plate appearances in 2018.
But remember, we’re trying to find out how much he improved from last season. In 2017, Story had just 5.9% Brls / PA. This means that he improved by 2.1% from 2017 to 2018. Not bad! Or…is it? They don’t put Brls / PA on the back of baseball cards yet, so I’ll help put this in perspective.
Here is a top-ten list of players with the most improvement in Brls / PA from last season to this season:

Huh. No Story. And by the looks of it, an improvement of 2.1% isn’t even close to the top-ten.
So where is he? A humbling 53rd (although there are a few people tied with him):

As always, the data doesn’t lie. Clearly, Trevor Story is not the most improved. But the data can also vary with differing sample sizes, which is exactly what we have here. We aren’t even to the all-star break. Trevor Story (and everyone else) still has many more plate appearances to come. Who knows how many barrels he has in his future? And besides, Story had a higher Brls / PA in 2017 than any of the top-ten most improved. One could say that there was less “room for improvement” to begin with.
The important part is that Story is improving. After looking at the data, I can honestly say my gut was wrong about his season so far. I’m seeing a satisfying change in his numbers, and that makes me look at his game in a different light. So, Mr. Story, keep on keepin’ on. We’ll be checking the leaderboards for you.
(Quick note: the data that I used for these charts was taken from before the weekend, so it’s a few days old. These numbers have likely shifted a little bit since then, but most likely not by any significant margin.)
